What Hardiness Zones Actually Measure
When you see a plant label that reads "Hardy to Zone 5," it's communicating one specific piece of information: that plant can typically survive winter temperatures as low as −20°F, which is the lower threshold of USDA Zone 5. Nothing more, nothing less.
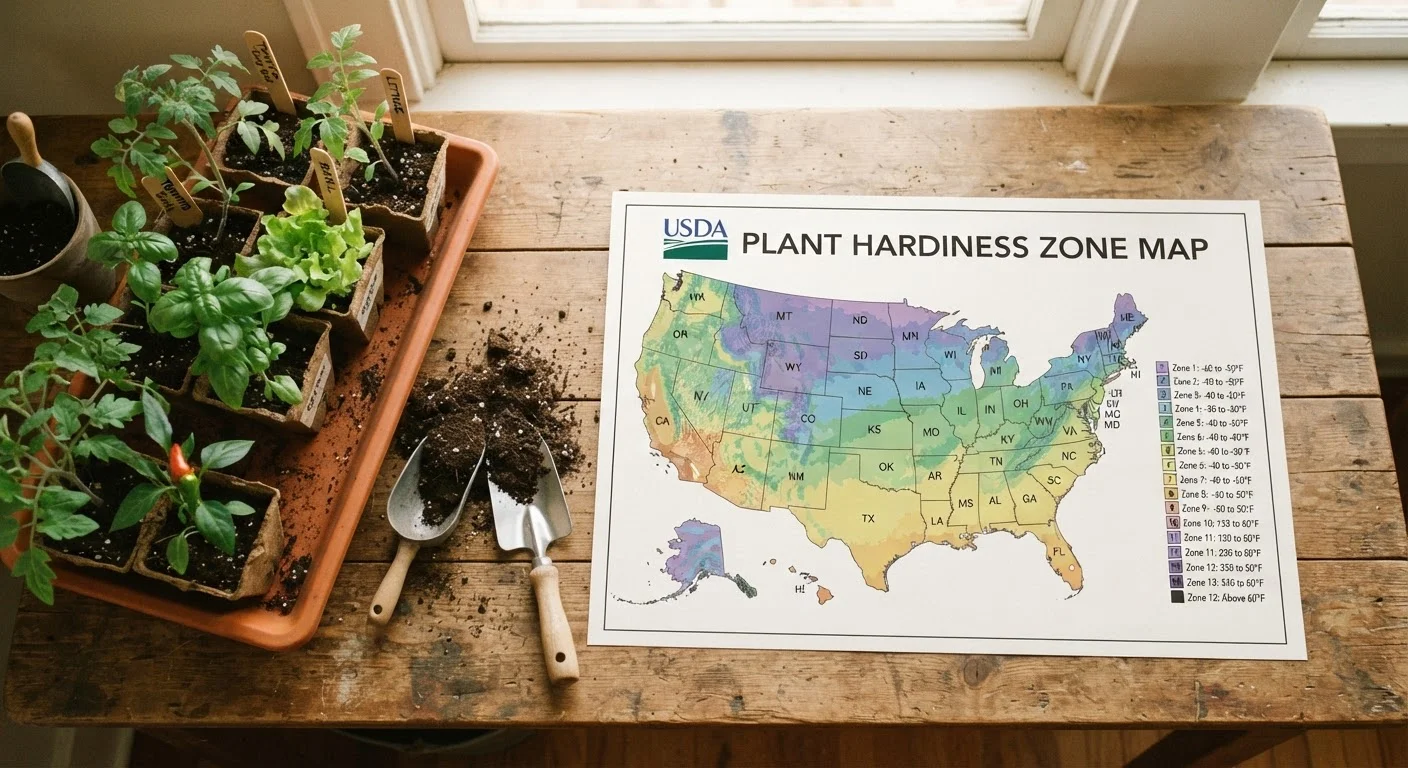
The USDA Plant Hardiness Zone Map was first published in the 1960s and has been refined several times since. It divides the contiguous U.S., Alaska, Hawaii, and Puerto Rico into numbered zones, each spanning a 10°F range of average annual extreme minimum temperature. Zones are further split into "a" and "b" half-zones representing 5°F increments.
The critical word is average. A zone rating doesn't guarantee a plant will survive a record cold snap - it describes what typically happens based on decades of weather data. This distinction matters most in transitional zones like 6 or 7, where winters can vary significantly from year to year.
Zones Are Based on Averages, Not Records
The USDA map is calculated from 30-year average annual extreme minimum temperatures - not the coldest night ever recorded. A once-in-a-decade cold event can kill plants rated for your zone. When planting investment-level specimens like ornamental trees or shrubs, choosing a plant rated for a zone colder than yours provides a meaningful safety buffer.
What Zones Don't Tell You
Hardiness zones are a starting point, not a complete answer. They measure only one variable - cold - and leave out several other factors that profoundly affect whether a plant thrives or fails.
- Summer heat: A plant that winters fine in Zone 7 may struggle if it can't handle the region's hot, humid summers. The American Horticultural Society's Heat Zone Map addresses this gap separately.
- Soil drainage: Many plants that tolerate cold die in wet winter soil. Crown rot from saturated ground kills more perennials than frost does in many parts of the country.
- Wind and desiccation: Exposed sites lose moisture rapidly in winter. Broadleaf evergreens like rhododendrons can suffer severe leaf scorch or dieback from drying winds even in appropriate zones.
- Snow cover: A consistent snow layer actually insulates plant roots. In low-snowfall areas, plants rated for your zone may still struggle without that natural protection.
For a fuller picture of how climate shapes your garden calendar, see The American Gardening Calendar, which maps seasonal tasks across different U.S. climate regions.
Microclimates: Why Your Yard Can Differ From the Map
Your official zone tells you the regional average, but your specific yard may be meaningfully warmer or colder. These localized variations are called microclimates, and every property has them.
A south-facing brick wall absorbs heat during the day and radiates it overnight, effectively creating a pocket that behaves like a zone warmer. A low-lying area where cold air pools on still nights can be a half-zone colder than an elevated spot just 50 feet away. Urban areas tend to run warmer than surrounding rural zones due to the heat island effect.
Savvy gardeners scout their yards before planting, noting where frost lingers longest in spring, where snow melts first, and where the wind hits hardest. That observation often matters more than the zip-code zone. This awareness is especially useful when selecting perennials that need to survive the winter.
Map Your Yard Before You Plant
Spend a full growing season observing your yard before placing permanent plantings. Note shaded spots, frost pockets, and wind corridors. A simple hand-drawn sketch updated across seasons will help you match plants to the exact microclimate conditions where they'll thrive - a step that many gardeners skip and later regret.
Applying Zone Data Practically in Your Garden
The most reliable approach is to choose plants rated for your zone or one zone colder. This built-in buffer accounts for unusually harsh winters and the extra vulnerability of plants in their first year or two before they're fully established.
When in doubt, favor plants native to your region. Native species have evolved to handle local temperature swings, soil conditions, and precipitation patterns without extra intervention. Our guide to native plants for American home gardens highlights species that are already adapted to thrive in their respective zones.
Before the cold sets in each year, take steps to protect borderline-hardy plants. Mulching root zones, wrapping tender shrubs, and moving container plants into shelter can extend survival. For a complete pre-winter checklist, see Fall Garden Prep: What Needs to Happen Before the First Frost.
13
USDA hardiness zones covering the U.S.
Each zone spans a 10°F range of average annual extreme minimum temperature, with half-zones (a/b) splitting each into 5°F increments.
~50%
Of U.S. locations shifted warmer in 2023 update
The USDA's 2023 map revision, based on 1991-2020 data, moved roughly half of U.S. locations into a warmer half-zone compared to the previous 1990 edition.
30 years
Of temperature data used to define each zone
USDA zone calculations use 30-year climate normals to smooth out year-to-year variability and reflect long-term temperature patterns.